If you are a .NET developer, you have probably used ILogger to write logs. But when your application becomes bigger, logs alone are not always enough.
You may start asking questions like:
- Why is my API slow?
- Which database query is taking too long?
- Which external API is causing the delay?
- How many requests are failing?
- What happened to a particular request when it passed through multiple services?
- This is where observability and OpenTelemetry become useful.
According to the official OpenTelemetry documentation, OpenTelemetry .NET supports the three major telemetry signals: traces, metrics, and logs.
What Is OpenTelemetry?
In simple words:
OpenTelemetry is an open-source standard and set of tools used to collect telemetry data from your application.
Telemetry means information about what your application is doing.
For example:
Your .NET Application
        |
        +---- Logs
        |
        +---- Metrics
        |
        +---- Traces
        |
        v
   OpenTelemetry
        |
        v
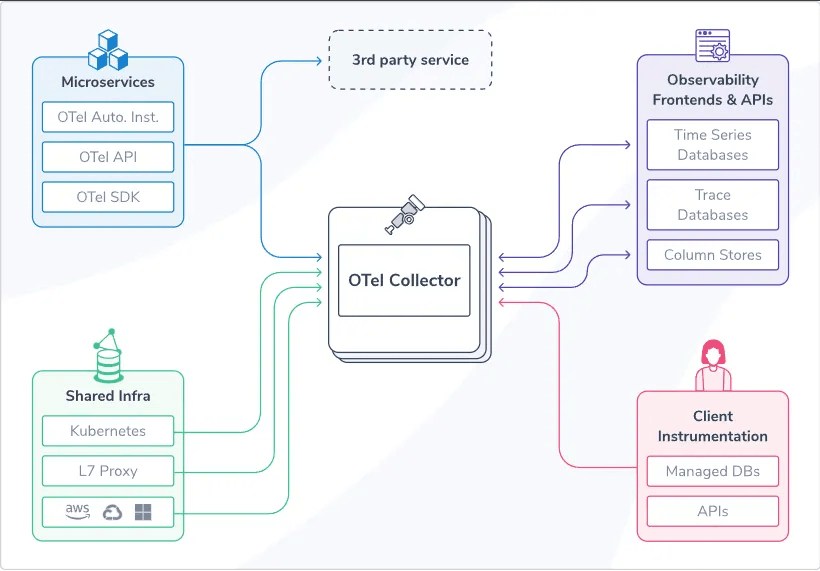
Observability System- OpenTelemetry can collect this information and send it to an observability backend for analysis.
- It is important to understand that OpenTelemetry itself is not simply a dashboard.
- Think of it as a standard way of generating, collecting, and exporting telemetry.
What Is Observability?
Before OpenTelemetry, let's understand observability.
Suppose you have a Web API:
User
 |
 v
.NET API
 |
 +---- Database
 |
 +---- Payment API
 |
 +---- Email Service
A customer tells you:
"The checkout page takes 5 seconds to load."
You need to find out where those 5 seconds are being spent.
Maybe:
API processing       200 ms
Database              500 ms
Payment API          4000 ms
Email Service         300 ms
----------------------------
Total                5000 ms
- Now you immediately know that the payment API is the main problem.
- This ability to understand what is happening inside your system is called observability.
- In .NET, observability commonly combines logs, metrics, and distributed tracing.
The Three Pillars of Observability
There are three important types of telemetry.
             Observability
                   |
       +-----------+-----------+
       |           |           |
      Logs       Metrics     Traces
Let's understand them one by one.
1. Logs
Logs tell us about events that happened in the application.
For example:
// Write an informational log when an order is created.
_logger.LogInformation("Order {OrderId} was created",orderId);
The output could look like:
Order 1001 was createdLogs can answer:
What happened?
2. Metrics
Metrics are numbers that help us understand the behavior of an application over time.
For example:
Requests per second = 250
Error rate = 1.2%
Average response time = 180 ms
CPU usage = 65%
Memory usage = 3 GB
For example, if you have 100,000 requests and 2,000 failed requests, your error rate is a useful metric.
3. Traces
Traces show the journey of a request through your application.
Suppose a user creates an order:
POST /orders
     |
     +----> Order Service
     |
     +----> Database
     |
     +----> Payment Service
     |
     +----> Email Service
A trace can show something like:
POST /orders              2500 ms
 |
 +-- Database              200 ms
 |
 +-- Payment Service      1800 ms
 |
 +-- Email Service         300 ms
Now we know that the payment service is taking most of the time.
Logs vs Metrics vs Traces
A simple way to remember them is:
| Telemetry | Question | Example |
|---|---|---|
| Logs | What happened? | Payment failed |
| Metrics | How much/how often? | 500 errors per minute |
| Traces | Where did the request go? | Payment API took 2 seconds |
What Is a Trace and What Is a Span?
- When learning OpenTelemetry, you will hear the word span a lot.
- A trace represents the complete journey of a request.
- A span represents one operation within that journey.
For example:
Trace: Place Order
    Span: HTTP POST /orders
       |
       +-- Span: Database Query
       |
       +-- Span: Payment API
       |
       +-- Span: Send Email
So:
Trace = Complete request
Span = One operation inside the request
In .NET, OpenTelemetry tracing is built around the System.Diagnostics APIs, including
ActivitySource and Activity. The .NET Activity concept maps to an OpenTelemetry span.
Why Do We Need OpenTelemetry?
Imagine you have a simple application today:
Browser
   |
   v
.NET Web API
   |
   v
SQL Database
You can probably manage this with logs and normal debugging.
But your application may eventually become:
                 API Gateway
                      |
        +-------------+-------------+
        |             |             |
        v             v             v
   User Service  Order Service  Product Service
                      |
              +-------+-------+
              |               |
              v               v
        Payment Service   Notification
              |
              v
Database- Now one request can travel through many services.
- If the request fails, finding the problem becomes much harder.
- OpenTelemetry helps standardize the way telemetry is generated and collected across these components.
OpenTelemetry in .NET
OpenTelemetry has good support for .NET.
The official .NET implementation supports:
- Traces
- Metrics
- Logs
and provides instrumentation libraries for common .NET technologies.
For example, we can instrument an ASP.NET Core application.
Let's Create a Simple .NET API
First, create a new Web API project.
# Create a new ASP.NET Core Web API project.
dotnet new webapi -n OpenTelemetryDemo

# Move into the project directory.
cd OpenTelemetryDemo

# Run the application.
dotnet run
- Now we have a normal .NET application.
- Next, let's add OpenTelemetry.
Installing OpenTelemetry Packages
For basic ASP.NET Core tracing, install these packages:
# Core OpenTelemetry hosting integration.
dotnet add package OpenTelemetry.Extensions.Hosting

# Adds automatic instrumentation for ASP.NET Core requests.
dotnet add package OpenTelemetry.Instrumentation.AspNetCore

# Sends telemetry to the console.
dotnet add package OpenTelemetry.Exporter.Console
These packages are also used in the official OpenTelemetry ASP.NET Core getting-started example.
If you want to instrument outgoing HTTP requests:
# Automatically creates telemetry for HttpClient calls.
dotnet add package OpenTelemetry.Instrumentation.Http
Basic OpenTelemetry Configuration
Now open Program.cs.
A simple tracing setup looks like this:
using OpenTelemetry.Resources;
using OpenTelemetry.Trace;

var builder = WebApplication.CreateBuilder(args);

// Register OpenTelemetry with the ASP.NET Core application.
builder.Services.AddOpenTelemetry()

    // Add information about our service.
    .ConfigureResource(resource =>
        resource.AddService(
            serviceName: builder.Environment.ApplicationName))

    // Configure distributed tracing.
    .WithTracing(tracing =>
    {
        // Automatically create traces for incoming
        // ASP.NET Core HTTP requests.
        tracing.AddAspNetCoreInstrumentation();

        // Print traces to the console.
        // This is useful while learning and testing locally.
        tracing.AddConsoleExporter();
    });

var app = builder.Build();

// A simple endpoint.
app.MapGet("/", () =>
{
    return "Hello from OpenTelemetry!";
});

app.Run();
The important part is:
.AddAspNetCoreInstrumentation();This automatically creates telemetry for incoming ASP.NET Core HTTP requests. The official documentation shows that this instrumentation can capture information such as request duration, HTTP method, route, and response status.
What Does Automatic Instrumentation Mean?
The word instrumentation sounds complicated, but the idea is simple.
Instrumentation means:
Adding the ability to collect telemetry from your application.
For example, without instrumentation, you might have to manually write code for every request.
With:
.AddAspNetCoreInstrumentation()OpenTelemetry can automatically create telemetry for ASP.NET Core requests.
So when someone calls:
GET /api/productsOpenTelemetry can create a span for that request.
Adding HttpClient Instrumentation
Most real applications call other APIs.
For example:
Order API
    |
    v
Payment API
In .NET, you might use HttpClient.
Add:
using OpenTelemetry.Resources;
using OpenTelemetry.Trace;

var builder = WebApplication.CreateBuilder(args);

builder.Services.AddOpenTelemetry()
    .ConfigureResource(resource =>
        resource.AddService(
            serviceName: builder.Environment.ApplicationName))

    .WithTracing(tracing =>
    {
        // Trace incoming ASP.NET Core requests.
        tracing.AddAspNetCoreInstrumentation();

        // Trace outgoing HttpClient requests.
        tracing.AddHttpClientInstrumentation();

        // Display traces in the console.
        tracing.AddConsoleExporter();
    });

var app = builder.Build();

app.MapGet("/", () => "Hello!");

app.Run();
Now OpenTelemetry can capture both:
Incoming request
       |
       v
ASP.NET Core
       |
       v
Outgoing HttpClient request
This is very useful in microservice applications.
Example HttpClient Code
Suppose our API calls another service:
app.MapGet("/products", async (IHttpClientFactory factory) =>
{
    // Get a configured HttpClient from dependency injection.
    var client = factory.CreateClient();

    // Call another API.
    var response = await client.GetAsync(
        "https://example.com/products");

    // Return the response status.
    return response.StatusCode.ToString();
});- With HTTP instrumentation enabled, OpenTelemetry can create telemetry for that outgoing request.
- You don't need to manually create a span just for this HTTP call.
Adding Runtime Metrics
OpenTelemetry can also collect information about the .NET runtime.
Install the runtime instrumentation package:
# Adds .NET runtime metrics.
dotnet add package OpenTelemetry.Instrumentation.Runtime
Then configure metrics:
using OpenTelemetry.Metrics;
using OpenTelemetry.Resources;
using OpenTelemetry.Trace;

var builder = WebApplication.CreateBuilder(args);

builder.Services.AddOpenTelemetry()

    .ConfigureResource(resource =>
        resource.AddService(
            serviceName: builder.Environment.ApplicationName))

    // -------------------------
    // Configure tracing
    // -------------------------
    .WithTracing(tracing =>
    {
        // Trace incoming HTTP requests.
        tracing.AddAspNetCoreInstrumentation();

        // Trace outgoing HttpClient requests.
        tracing.AddHttpClientInstrumentation();

        // Print traces to the console.
        tracing.AddConsoleExporter();
    })

    // -------------------------
    // Configure metrics
    // -------------------------
    .WithMetrics(metrics =>
    {
        // Collect ASP.NET Core metrics.
        metrics.AddAspNetCoreInstrumentation();

        // Collect .NET runtime metrics.
        metrics.AddRuntimeInstrumentation();
    });

var app = builder.Build();

app.MapGet("/", () => "Hello!");

app.Run();
Now we are collecting both traces and metrics.
What Is an Exporter?
- So far, we have collected telemetry.
- But where should the telemetry go?
- This is where an exporter comes in.
Think about the architecture:
.NET Application
       |
       v
OpenTelemetry
       |
       v
Exporter
       |
       v
Telemetry Backend
An exporter sends telemetry to another system.
For learning, we can use the console exporter:
.AddConsoleExporter();This simply prints telemetry in the terminal.
In a real production system, you will normally send telemetry to an observability backend.
What Is OTLP?
You will often see the term OTLP.
OTLP stands for:
OpenTelemetry Protocol
It is a standard protocol for transporting OpenTelemetry telemetry.
A common architecture looks like:
.NET Application
       |
       v
OpenTelemetry SDK
       |
       v
      OTLP
       |
       v
OpenTelemetry Collector
       |
       +----> Traces
       +----> Metrics
       +----> Logs
You don't have to understand every OTLP detail when starting.
For now, remember:
OTLP is one of the standard ways to send OpenTelemetry telemetry between systems.
What Is the OpenTelemetry Collector?
The OpenTelemetry Collector is a separate component that can receive, process, and export telemetry.
Imagine you have several applications:
Order API -------\
Payment API ------\
User API ----------> OpenTelemetry Collector
Product API -------/
The Collector can then send the telemetry to your chosen backend.
Conceptually:
Applications
     |
     v
OpenTelemetry Collector
     |
     +----> Tracing backend
     |
     +----> Metrics backend
     |
     +----> Logging backend
This can be very useful when you have many services.
Manual Instrumentation
Automatic instrumentation is great, but sometimes you want to trace your own business logic.
For example:
ProcessOrder
CalculatePrice
ProcessPayment
GenerateInvoice
These are business operations that the framework doesn't necessarily know about.
For these cases, we can create our own spans.
In .NET, we normally use ActivitySource.
Creating an ActivitySource
Create a class like this:
using System.Diagnostics;

public static class Telemetry
{
    // ActivitySource is used to create custom tracing activities.
    // Give it a unique name for your application or service.
    public static readonly ActivitySource ActivitySource =
        new ActivitySource("MyCompany.OrderService");
}
Now we can create a custom span.
Creating a Custom Span
Suppose we have an order service:
public async Task ProcessOrderAsync(int orderId)
{
    // Start a custom tracing span.
    using var activity =
        Telemetry.ActivitySource.StartActivity("ProcessOrder");

    // Add useful information to the span.
    activity?.SetTag("order.id", orderId);

    // Simulate some business logic.
    await Task.Delay(100);

    // When the using block finishes,
    // the activity is automatically stopped.
}
Let's understand this line:
StartActivity("ProcessOrder");It creates a span named:
ProcessOrderThen:
activity?.SetTag("order.id", orderId);adds extra information.
The result might look conceptually like:
Span: ProcessOrder

order.id = 12345
duration = 100 ms
Why Do We Use activity?
You may notice this:
activity?.SetTag(...)The ? is important.
StartActivity() can return null when no listener is interested in that activity.
So this:
activity?.SetTag(...)means:
"If an Activity exists, add this tag."
It prevents a null-reference exception.
Registering Your ActivitySource
There is one important step that beginners often miss.
We created:
new ActivitySource("MyCompany.OrderService");But OpenTelemetry also needs to listen to this source.
Add:
.WithTracing(tracing =>
{
    // Listen to our custom ActivitySource.
    tracing.AddSource("MyCompany.OrderService");

    // Automatically trace ASP.NET Core requests.
    tracing.AddAspNetCoreInstrumentation();

    // Export traces to the console.
    tracing.AddConsoleExporter();
});
The name must match.
ActivitySource name:
MyCompany.OrderService

AddSource:
MyCompany.OrderService
The OpenTelemetry .NET SDK uses an explicit opt-in model for ActivitySource; sources need to be registered with the tracer provider to be collected.
A Complete Simple Example
Let's put the important pieces together.
using System.Diagnostics;
using OpenTelemetry.Resources;
using OpenTelemetry.Trace;

// Create the application builder.
var builder = WebApplication.CreateBuilder(args);

// Configure OpenTelemetry.
builder.Services.AddOpenTelemetry()

    // Tell OpenTelemetry which service is producing telemetry.
    .ConfigureResource(resource =>
        resource.AddService("MyOrderService"))

    // Configure tracing.
    .WithTracing(tracing =>
    {
        // Automatically trace incoming ASP.NET Core requests.
        tracing.AddAspNetCoreInstrumentation();

        // Automatically trace outgoing HttpClient requests.
        tracing.AddHttpClientInstrumentation();

        // Listen to our custom ActivitySource.
        tracing.AddSource("MyOrderService");

        // Print traces to the terminal.
        tracing.AddConsoleExporter();
    });

var app = builder.Build();

// Create an ActivitySource for custom application tracing.
var activitySource = new ActivitySource("MyOrderService");

app.MapGet("/order/{id}", async (int id) =>
{
    // Create a custom span for our business operation.
    using var activity =
        activitySource.StartActivity("ProcessOrder");

    // Add the order ID as span information.
    activity?.SetTag("order.id", id);

    // Pretend that we are doing some work.
    await Task.Delay(200);

    return Results.Ok(new
    {
        OrderId = id,
        Message = "Order processed successfully"
    });
});

app.Run();
Now call:
GET /order/1001You can think about the resulting trace like this:
GET /order/{id}
      |
      +---- ProcessOrder
The first span is automatically created for the HTTP request.
The second span is our custom business operation.
Adding a Custom Metric
Tracing tells us about individual requests.
But what if we want to know:
How many orders have been created?
A metric is better for this.
.NET provides the Meter API for creating metrics, and OpenTelemetry can collect those metrics.
Create a metric:
using System.Diagnostics.Metrics;

public static class OrderMetrics
{
    // Create a Meter for our application.
    public static readonly Meter Meter =
        new Meter("MyCompany.OrderService");

    // Create a counter.
    // This counter will track how many orders are created.
    public static readonly Counter<long> OrdersCreated =
        Meter.CreateCounter<long>(
            "orders.created",
            description: "Number of orders created");
}
Now increment the counter:
// Add 1 whenever an order is created.
OrderMetrics.OrdersCreated.Add(1);
After 100 orders:
orders.created = 100This is much more useful than searching through 100 log messages just to calculate the number.
Registering the Custom Meter
Just like ActivitySource, we need to tell OpenTelemetry to listen to our
Meter.
builder.Services.AddOpenTelemetry()
    .WithMetrics(metrics =>
    {
        // Collect ASP.NET Core metrics.
        metrics.AddAspNetCoreInstrumentation();

        // Collect .NET runtime metrics.
        metrics.AddRuntimeInstrumentation();

        // Listen to our custom Meter.
        metrics.AddMeter("MyCompany.OrderService");

        // Export metrics to the console.
        metrics.AddConsoleExporter();
    });
Now OpenTelemetry can collect our custom orders.created metric.
Custom Metric with an Endpoint
Here is a small example:
app.MapPost("/orders", () =>
{
    // In a real application, we would save the order
    // to a database here.

    // Increase the custom metric by 1.
    OrderMetrics.OrdersCreated.Add(1);

    // Return a successful response.
    return Results.Ok("Order created");
});
Every successful request increases:
orders.createdby one.
Automatic vs Manual Instrumentation
You might now be wondering:
Should I manually create an Activity for everything?
No.
Start with automatic instrumentation.
For example:
.AddAspNetCoreInstrumentation()
.AddHttpClientInstrumentation()
These handle common framework operations.
Then add manual instrumentation for important business operations:
ProcessOrder
ProcessPayment
GenerateInvoice
CalculateShipping
CreateSubscription
A good approach is:
Automatic instrumentation
          +
Useful custom instrumentation
          =
Better observability
OpenTelemetry's documentation also recommends combining automatic and manual instrumentation when you need additional application-specific visibility.
OpenTelemetry and Databases
Suppose your application uses a database.
Your request may look like:
GET /orders
    |
    v
Order Service
    |
    v
SQL Database
You may want to know:
API request       800 ms
Database query    650 ms
Other work 150 ms- Database instrumentation can help you understand this.
- The exact package and configuration depend on the database technology and library you are using.
The important idea is:
Request
  |
  +---- Database operation
The database operation can become part of the trace.
Distributed Tracing
Now let's talk about one of the biggest benefits of OpenTelemetry.
Suppose you have:
Client
  |
  v
Order API
  |
  v
Payment API
  |
  v
Payment Database- A request starts at the Order API.
- It then calls the Payment API.
- The Payment API talks to the database.
- Distributed tracing can connect these operations into one trace.
Conceptually:
Trace: Create Order

Order API                 2000 ms
 |
 +-- Payment API           1700 ms
       |
       +-- Database        1400 ms
Now you can see exactly where the time is being spent.
Why Trace Context Matters
How does the Payment API know that the request came from the Order API?
Trace context is propagated between services.
Conceptually:
Order API
    |
    | Trace Context
    v
Payment API
    |
    | Trace Context
    v
Database
This allows different operations to be connected to the same overall request.
For HTTP-based communication, supported .NET/OpenTelemetry instrumentation can handle much of this propagation automatically.
OpenTelemetry and Logs
You may already use:
ILoggerFor example:
_logger.LogInformation("Processing order {OrderId}",orderId);Logs are still useful even when you have traces and metrics.
A useful observability setup might look like:
                  Application
                      |
          +-----------+-----------+
          |           |           |
         Logs      Metrics      Traces
          |           |           |
          +-----------+-----------+
                      |
                      v
             Observability System
- The goal is not to replace logs with traces.
- The goal is to use each type of telemetry for the job it is best at.
A Real-World Debugging Example
Imagine your customer reports:
"Checkout is very slow."
You look at metrics and see:
Average checkout time = 4 secondsThen you open a trace:
POST /checkout            4 seconds
 |
 +-- Validate cart         100 ms
 |
 +-- Database              300 ms
 |
 +-- Payment API          3300 ms
 |
+-- Send email 300 ms- Now you know the payment API is the main problem.
- Then you check logs related to that operation and find:
Payment provider timeout- Now you have a much better understanding of the problem.
This is the real power of combining:
Metrics + Traces + LogsSampling
Imagine your API receives:
10 million requests per dayDo you really need to keep every trace?
Maybe not.
Sampling lets you decide which traces should be recorded or exported.
For example:
10,000,000 requests
        |
        v
     Sampling
        |
        v
1,000,000 traces- Sampling can help reduce storage and processing costs.
- But don't blindly sample everything at a very low rate. You may accidentally lose important information.
- A good production sampling strategy depends on your application and observability requirements.
What Is Grafana?
Grafana is commonly used to create dashboards for telemetry.
For example:
----------------------------------
        API Dashboard
----------------------------------
Requests/sec          350
Error rate             1.2%
Average latency       210 ms
CPU                    62%
Memory                  3 GB
----------------------------------
OpenTelemetry and Grafana are not the same thing.
Think:
OpenTelemetry
     |
     | Collect / export telemetry
     v
Observability backend
     |
     v
Grafana
     |
     v
Dashboard
The exact architecture depends on the backend you choose.
What Is Jaeger?
Jaeger is commonly used for distributed tracing.
You can use it to visually inspect traces.
For example:
GET /orders
--------------------------------
API                  500 ms
 |
 +-- Database        100 ms
 |
 +-- Payment API     300 ms
 |
 +-- Other           100 ms
--------------------------------
This is especially useful when learning tracing because you can visually see the request journey.
OpenTelemetry in a Microservices Architecture
A larger application might look like:
                    Client
                       |
                       v
                  API Gateway
                       |
          +------------+------------+
          |            |            |
          v            v            v
       User API     Order API    Product API
                       |
                       v
                  Payment API
                       |
                       v
                    Database

Each service
      |
      v
OpenTelemetry
      |
      v
OpenTelemetry Collector
      |
      +------> Metrics
      +------> Logs
+------> Traces- This is where OpenTelemetry becomes particularly useful.
- Different services can produce telemetry using a common approach.
Common Beginner Mistakes
1. Thinking OpenTelemetry Is a Dashboard
It isn't.
- OpenTelemetry helps generate, collect, process, and export telemetry.
- A separate system is normally used to store and visualize that data.
2. Creating Spans Everywhere
Don't do this:
// Usually unnecessary.
StartActivity("Method1");
StartActivity("Method2");
StartActivity("Method3");
StartActivity("Method4");
Instead, focus on meaningful operations.
3. Forgetting AddSource()
If you create:
new ActivitySource("MyCompany.OrderService");remember to register it:
tracing.AddSource("MyCompany.OrderService");Otherwise, your custom spans may not be collected.
4. Putting Too Much Data in Tags
Don't attach huge objects to every span.
Prefer small, useful attributes:
order.id
order.type
payment.status
and make sure the information is safe to collect.
5. Only Using Logs
Logs are useful, but they don't give you the complete picture.
Use:
Logs    -> Events
Metrics -> Measurements
Traces  -> Request flow
6. Ignoring Sampling
Large applications can produce huge amounts of telemetry.
Think about sampling and telemetry volume before going to production.
A Good Beginner Project
If you want to practice OpenTelemetry, build a small application like this:
Online Store API
       |
       +---- Products
       |
       +---- Orders
       |
       +---- Payments
Add:
ASP.NET Core instrumentation
HttpClient instrumentation
Runtime metrics
Custom order metric
Custom ProcessOrder span
Console exporter
Then make a request:
POST /ordersTry to answer:
What trace was created?
How long did the request take?
How many spans were created?
What custom attributes are available?
How many orders were created?
What happens when the payment API fails?
This small project will teach you much more than simply reading documentation.
The Big Picture
At this point, you can think about OpenTelemetry like this:
                  .NET Application
                         |
          +--------------+--------------+
          |              |              |
        Logs           Metrics        Traces
          |              |              |
          +--------------+--------------+
                         |
                         v
                  OpenTelemetry
                         |
                         v
                     Exporter
                         |
                         v
              Collector / Backend
                         |
              +----------+----------+
              |          |          |
              v          v          v
            Logs      Metrics     Traces
That is the main idea.
Final Example: Simple .NET Setup
Here is a compact example you can keep as a reference.
using System.Diagnostics;
using OpenTelemetry.Metrics;
using OpenTelemetry.Resources;
using OpenTelemetry.Trace;

var builder = WebApplication.CreateBuilder(args);

// Name of the application/service.
// This name will appear in your telemetry.
const string ServiceName = "MyOrderService";

// Register OpenTelemetry.
builder.Services.AddOpenTelemetry()

    // Add service information to telemetry.
    .ConfigureResource(resource =>
        resource.AddService(ServiceName))

    // -------------------------
    // Configure tracing
    // -------------------------
    .WithTracing(tracing =>
    {
        // Automatically trace incoming HTTP requests.
        tracing.AddAspNetCoreInstrumentation();

        // Automatically trace outgoing HttpClient calls.
        tracing.AddHttpClientInstrumentation();

        // Collect our custom ActivitySource.
        tracing.AddSource(ServiceName);

        // Print traces to the console.
        tracing.AddConsoleExporter();
    })

    // -------------------------
    // Configure metrics
    // -------------------------
    .WithMetrics(metrics =>
    {
        // Collect ASP.NET Core metrics.
        metrics.AddAspNetCoreInstrumentation();

        // Collect .NET runtime metrics.
        metrics.AddRuntimeInstrumentation();
    });

var app = builder.Build();

// Create a source for custom application traces.
var activitySource = new ActivitySource(ServiceName);

app.MapGet("/orders/{id}", async (int id) =>
{
    // Create a custom span.
    using var activity =
        activitySource.StartActivity("ProcessOrder");

    // Add useful information to the span.
    activity?.SetTag("order.id", id);

    // Simulate business processing.
    await Task.Delay(100);

    // Return the result.
    return Results.Ok(new
    {
        OrderId = id,
        Status = "Processed"
    });
});

app.Run();
This small example demonstrates the most important concepts:
ASP.NET Core instrumentation
        +
HttpClient instrumentation
        +
Runtime metrics
        +
Custom ActivitySource
        +
Custom span
        +
Telemetry exporter
Conclusion
OpenTelemetry can look complicated when you first see words like:
Trace
Span
Activity
ActivitySource
Meter
Instrumentation
Exporter
OTLP
Collector
Sampling- But the basic idea is actually quite simple.
- Your application produces information.
- OpenTelemetry helps you collect and export that information.
Remember:
Logs
"What happened?"

Metrics
"How much/how often?"

Traces
"Where did the request go?"
- Don't try to instrument every method in your application.
- Start small, look at the telemetry, understand what you are seeing, and then gradually add more.
- Once you understand the basics, OpenTelemetry becomes much less scary.
The simplest definition to remember is:
OpenTelemetry gives your .NET application a standard way to produce, collect, and export observability data so you can understand what your application is doing.
The official OpenTelemetry .NET documentation currently lists traces, metrics, and logs as stable signals and provides dedicated guides for each area.
