In modern distributed systems, understanding what’s happening inside your application is just as important as building it. This is where OpenTelemetry comes in—an open-source, vendor-neutral standard for collecting logs, metrics, and traces.
If you’re working with .NET Core, OpenTelemetry provides a powerful way to monitor performance, debug issues, and gain deep insights into your applications.
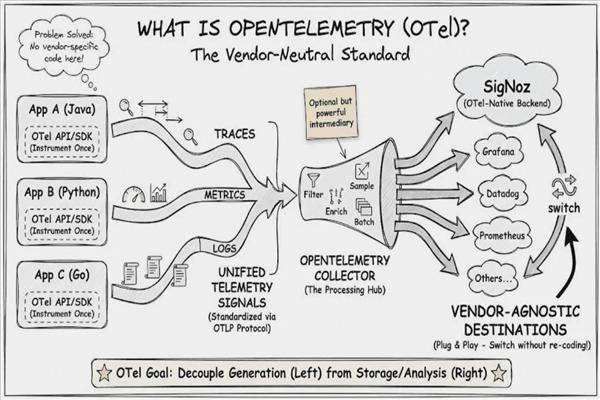
What is OpenTelemetry?
OpenTelemetry (often called OTel) is a unified framework that helps developers:
- Collect telemetry data (logs, metrics, traces)
- Export data to monitoring tools
- Analyze system performance
It is backed by the Cloud Native Computing Foundation and is widely adopted across cloud-native ecosystems.
Why Use OpenTelemetry in .NET Core?
1. Unified Observability
- Instead of using separate tools for logs, metrics, and tracing, OpenTelemetry combines everything.
2. Vendor Neutrality
You’re not locked into a specific tool like:
- Prometheus
- Jaeger
- Grafana
You can switch exporters anytime.
3. Distributed Tracing Support
- Track requests across microservices and APIs.
4. Performance Monitoring
- Identify bottlenecks in real-time.
Core Concepts of OpenTelemetry
1. Traces
- A trace represents a request flowing through your system.
- Example: API → Service → Database
- Helps debug latency issues
2. Spans
- A span is a unit of work inside a trace.
- API call
- DB query
- External HTTP request
3. Metrics
Numerical data like:
- CPU usage
- Request count
- Response time
4. Logs
- Structured event logs for debugging.
Architecture Overview
Application (.NET Core)
        ↓
OpenTelemetry SDK
        ↓
Exporter (Jaeger / Prometheus / OTLP)
        ↓
Monitoring Tool (Grafana, etc.)
Getting Started with OpenTelemetry in .NET Core
Step 1: Install Required NuGet Packages
dotnet add package OpenTelemetry.Extensions.Hosting
dotnet add package OpenTelemetry.Instrumentation.AspNetCore
dotnet add package OpenTelemetry.Instrumentation.Http
dotnet add package OpenTelemetry.Exporter.Console
Step 2: Configure OpenTelemetry
In Program.cs:
using OpenTelemetry.Trace;
using OpenTelemetry.Resources;

var builder = WebApplication.CreateBuilder(args);

builder.Services.AddOpenTelemetry()
    .WithTracing(tracerProviderBuilder =>
    {
        tracerProviderBuilder
            .SetResourceBuilder(ResourceBuilder.CreateDefault().AddService("MyApp"))
            .AddAspNetCoreInstrumentation()
            .AddHttpClientInstrumentation()
            .AddConsoleExporter();
    });

var app = builder.Build();

app.MapGet("/", () => "Hello OpenTelemetry!");

app.Run();
Step 3: Run the Application
When you run the app, you’ll see trace logs printed in the console.
Adding Distributed Tracing with Jaeger
To visualize traces, integrate with Jaeger.
Install Exporter:
dotnet add package OpenTelemetry.Exporter.Jaeger
Update Configuration:
.AddJaegerExporter(options =>
{
    options.AgentHost = "localhost";
    options.AgentPort = 6831;
});
Now you can view traces in the Jaeger UI.
Metrics with Prometheus
To collect metrics, integrate with Prometheus.
dotnet add package OpenTelemetry.Exporter.Prometheus.AspNetCore
builder.Services.AddOpenTelemetry()
    .WithMetrics(metrics =>
    {
        metrics.AddAspNetCoreInstrumentation()
               .AddPrometheusExporter();
    });

app.MapPrometheusScrapingEndpoint();
Logging Integration
OpenTelemetry can also integrate with .NET logging:
builder.Logging.AddOpenTelemetry(options =>
{
    options.AddConsoleExporter();
});
Best Practices
Use meaningful service names
Avoid over-collecting data (cost optimization)
Use sampling in production
Secure telemetry data
Monitor exporter performance
Real-World Use Cases
Microservices monitoring
Debugging production issues
SLA monitoring
Cloud-native applications
OpenTelemetry vs Traditional Logging
| Feature | Traditional Logging | OpenTelemetry |
|---|---|---|
| Structure | Unstructured | Structured |
| Tracing | No | Yes |
| Metrics | Limited | Full support |
| Correlation | Difficult | Easy |
Challenges
Initial setup complexity
Learning curve
Performance overhead (if misconfigured)
Future of OpenTelemetry in .NET
With increasing adoption of:
Microservices
Cloud-native apps
OpenTelemetry is becoming the standard for observability.
Microsoft is also actively improving OpenTelemetry support in .NET.
Conclusion
OpenTelemetry in .NET Core provides a powerful, flexible, and future-proof solution for application monitoring. By integrating it into your application, you gain:
Better visibility
Faster debugging
Improved performance insights
If you're building production-grade ASP.NET applications, adopting OpenTelemetry is no longer optional—it’s essential.